

Covid-19 Dashboard
My first r shiny project is a coronavirus dashboard.
I know there are already many dashboards out there, but it was for my personal practice and fun to make :)
*Note: This app is not optimized for mobile. I’m working on a solution. If you know a quick way to optimize shiny apps for mobile devices, please contact me (linkedin or E-Mail
Click Here to open the dashboard!
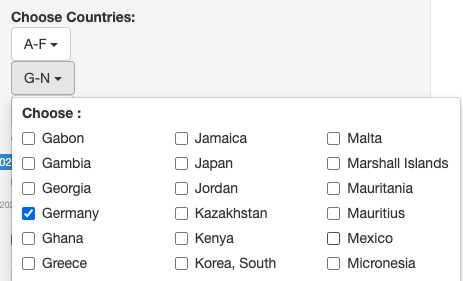
It features:
-
Cases over time
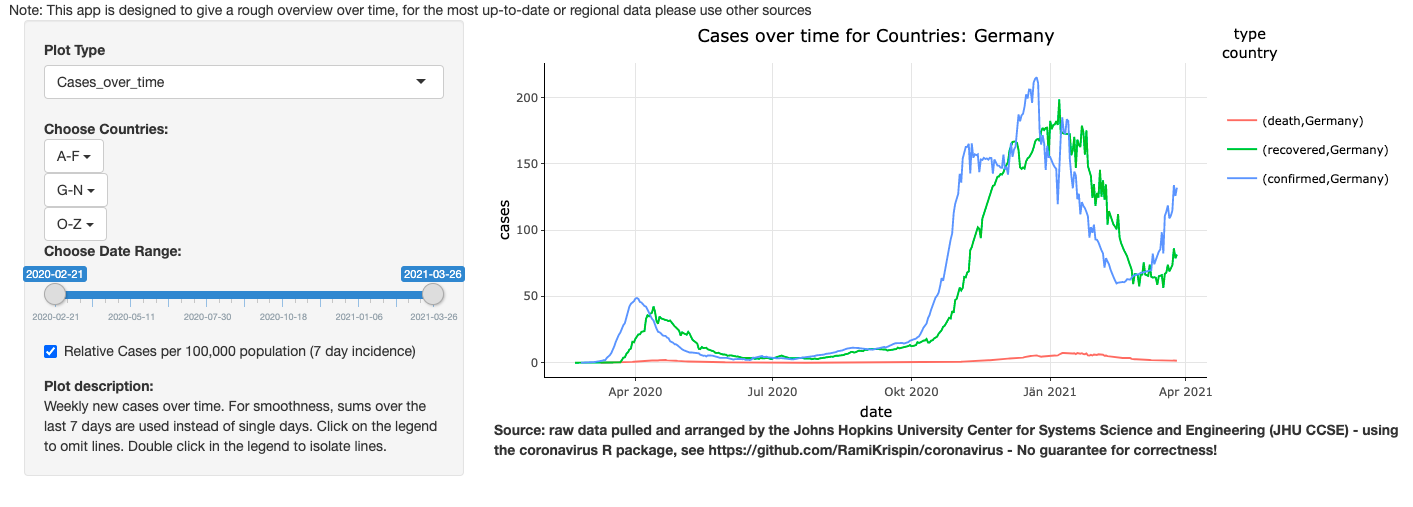
-
Availability to select multiple countries
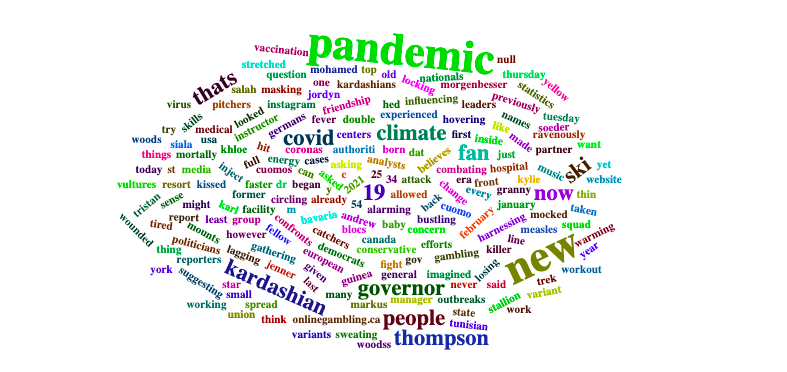
-
Word Clouds containing the most frequent words of news pages related to the coronavirus
(I have ideas about extending this feature to google trends & tweets, applying topic modelling algorithms or sentiment analysis)
Data is simply loaded via Rami Krispin’s daily updated dataset:
coronavirus <- read.csv("https://raw.githubusercontent.com/RamiKrispin/coronavirus/master/csv/coronavirus.csv", stringsAsFactors = FALSE)